Works with: the sample · your own assets
It splits into four tabs, and the first one is built to be read in about thirty seconds.
| Tab | What it holds |
|---|---|
| Summary | Portfolio health score · what stands out · overall gain |
| Composition | Concentration · country and sector spread · dividends · by kind |
| Returns | Period returns · max drawdown · risk profile · gains by holding |
| Projection | 1 · 3 · 5 · 10-year projections · goal progress · what to improve |
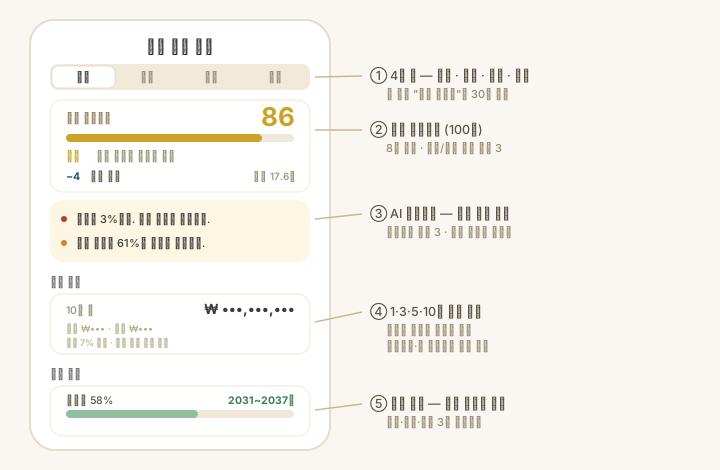
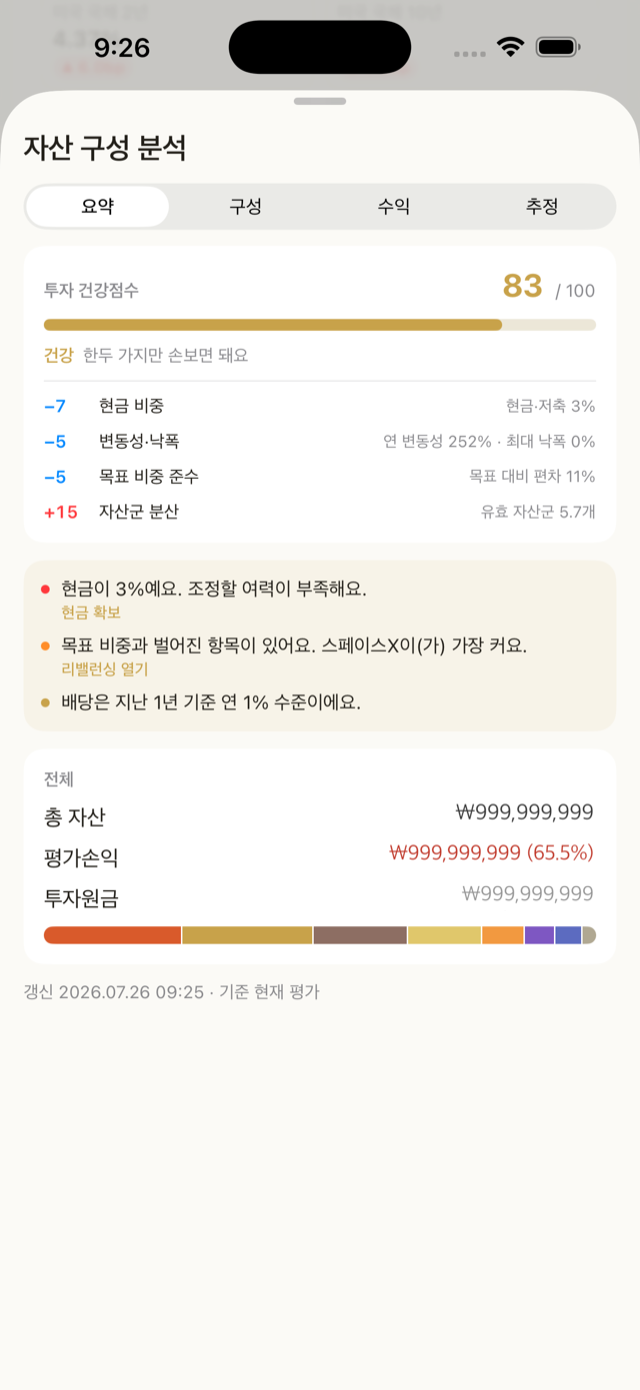
Portfolio health score
Scores the portfolio out of 100 and names the three biggest reasons it went up or down.
- Eight measures — holding spread · class spread · cash weight · currency spread · return · volatility · sticking to targets · goal progress.
- Spread is measured by lopsidedness, not by counting. Ten holdings split evenly and “one at 90% plus nine others” do not score the same (effective holding count).
- Measures without data are dropped and the rest normalized. Having no history yet does not cost you points.
- Structural risk is capped, not averaged away. If one holding passes 30%, the total is limited even when everything else is perfect.
- When the history is only a few days old, it says so. With no total-asset history, volatility and drawdown drop out of the maximum entirely, so the first few days are measured differently — without saying that, you get “80 yesterday, 72 today”.
What stands out
Pulls the measures together into sentences about what is worth noticing now.
- A rule engine produces at most three sentences, ordered by severity, and only one per kind (concentration, cash, and so on).
- For example: “Cash is 3% — too little room to adjust.” · “The top three holdings are 52% of everything.”
- They come from a rule engine inside the app — the public app calls no outside AI, and your asset data never leaves the device (see data · security).
Concentration · country · sector · dividends
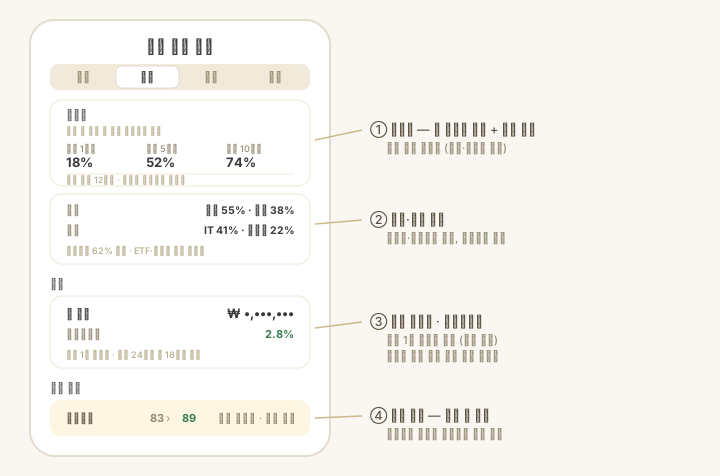
- Concentration — how much of your assets sit in your largest holdings. It reads like top 1: 12% · top 5: 42% · top 10: 61%. The effective spread shown beside it means “if the weights were even, how many holdings would this be like?” (bigger is better spread — the more one holding dominates, the smaller this gets, however many holdings you have). Cash, savings and real estate are left out; only tradable holdings count.
- Country — taken from the listing exchange, except for ETFs, which are counted by what they invest in (a Korea-listed US index ETF counts as the US).
- Sector — from the sector of individual stocks. ETFs and funds drop out because their contents are unknown, so the coverage is shown alongside: what share of your assets the number was measured over.
- Dividends — an expected yearly dividend and yield based on what was actually paid over the last 12 months (not a forecast). Only holdings with dividend data are counted, and the yield divides by those holdings' value, so the coverage is shown too.
Projections · goal progress
- 1 · 3 · 5 · 10 years — future assets from what you hold now plus what you add each month. At each point it splits what you put in (now plus contributions) from what the return added, so compounding is something you can see.
- Deposits and returns are kept apart. Money you paid in is taken out of the growth rate, so adding money is never mistaken for performance.
- Change the scenario and the monthly amount and all four numbers move at once (conservative 4% · neutral 7% · optimistic 10%).
- Goal progress — set a target amount (or a FIRE goal) under Settings > My assets > Target assets and you get how far along you are and when you might arrive, as a range of years (“2031–2037”). Set a target date and the progress feeds the health score too.
- Every projection is a calculation from assumptions and does not guarantee a return.
What to improve
- When a class steps outside its guardrails (a cash floor; ceilings for a single holding, a class, and crypto), it proposes the smallest move back.
- It shows the health score if you applied it (“83 → 89”).
- It will not tell you to sell with nowhere to put the money — advice that only piles up cash is not advice.
- Account- and holding-level gaps continue in the adjustment plan. The actual trading you do yourself, in your brokerage app.
Worth knowing
- Dividend, country and sector data is fetched once a day and cached. On a first launch it fills in a moment later.