Works with: the sample · your own assets · from 3.5.0 (iPhone · iPad · Mac · Android)
How it is measured
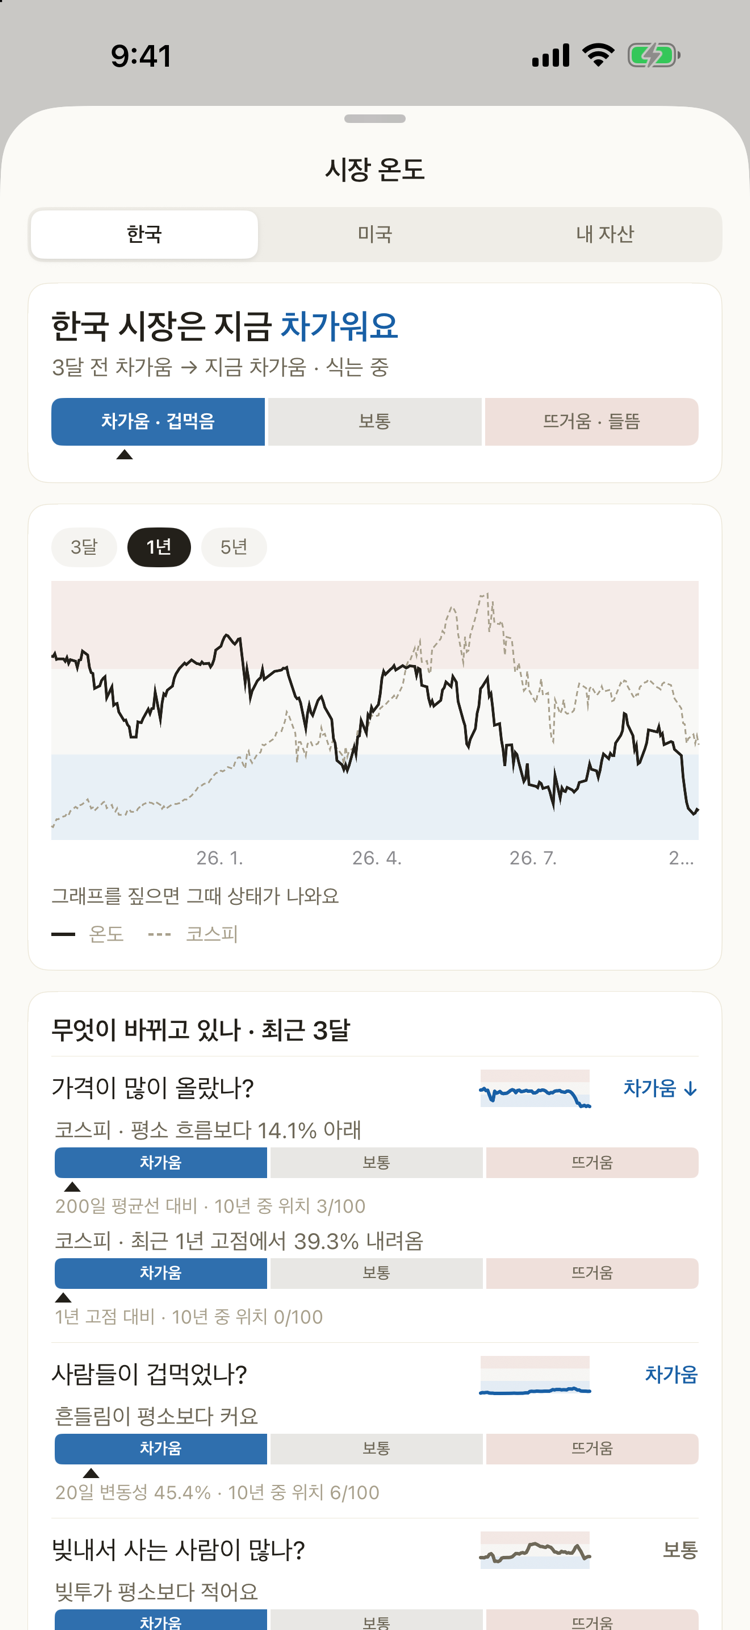
For each gauge, the app looks at where today's value sits within the last 10 years (0–100), then averages by question. A country's temperature is the average of its questions, not of its gauges — so a question with more gauges does not weigh more. Below 33 is cold, above 66 is hot. When it has moved more than 6 points since three months ago, ↑ warming or ↓ cooling is added.
| Country | Question | What it looks at |
|---|---|---|
| Korea | Have prices run up? | KOSPI vs its 200-day average, and how far below its 1-year high |
| Korea | Are people scared? | KOSPI 20-day volatility (bigger swings are colder) |
| Korea | Are people buying on margin? | Margin loans ÷ market cap, their one-month change, forced-sale share (more is colder) |
| Korea | Is money coming in or out? | One-month change in brokerage deposits and in foreign ownership |
| US | Have prices run up? | S&P 500 vs its 200-day average, Nasdaq 100 vs its 1-year high |
| US | Are people scared? | VIX and the high-yield spread (higher is colder) |
| US | Are Korean investors piling in? | 20-day net buying of US stocks settled by Korean investors |
Sources: Yahoo Finance (indexes), FRED (VIX · high-yield spread), KOFIA FreeSIS (margin · deposits · forced sales · foreign ownership), Korea Securities Depository open data (US stock settlement). They change once a day; the app refreshes every 6 hours. For VIX and the high-yield spread the app shows the source and the 10-year rank instead of the raw number.
The Home card
- One word per country — cold · normal · hot — and a three-cell bar.
- If your risk share is more than 5 pp above target while the market is hot, or more than 5 pp below while it is cold, a line appears that opens the adjustment plan. Otherwise it says nothing.
Tap it — Korea · US · Yours
Korea · US give a one-line verdict, the temperature and index over 3 months · 1 year · 5 years (press and slide on the chart to see a day), and each question's three-month trend with its gauges in plain words.
Yours puts the market and your portfolio on the same date axis.
- Your return — your return from the same starting day (bold gold) and KOSPI · S&P 500 (dotted), with the chosen gauge (red line) laid over them. The red and blue bands behind are that gauge's hot and cold zones. Return is counted from unrealised gain, so money you add does not show up as profit. Switch to Size to see your total and the money you put in (dotted).
- Your mix — risk · cash · target, recorded once a day; it becomes a trend after a few days.
- What moves with your portfolio — the correlation (−1 to +1) between each gauge and your return, using week-to-week changes. Tap a row to chart that gauge above. It needs a few weeks of history, and it does not mean one causes the other.